
Why so many?
In our last discussion, we covered both the psychological and mathematical significance of a moving average to technical analysis.
For this next piece to fit the puzzle, think “waves”.
The path of a given moving average is the collective wave of emotions shared by traders vibrating at a specific frequency.
Following KBWS 10 Commandments Rule #3, we understand our relationship with the market and/or any specific stock needs to be absent of emotional response.
This allows us to objectively tap into the frequency long enough to surf a wave’s upward momentum to our next technical decision point.
Still vibing with me?
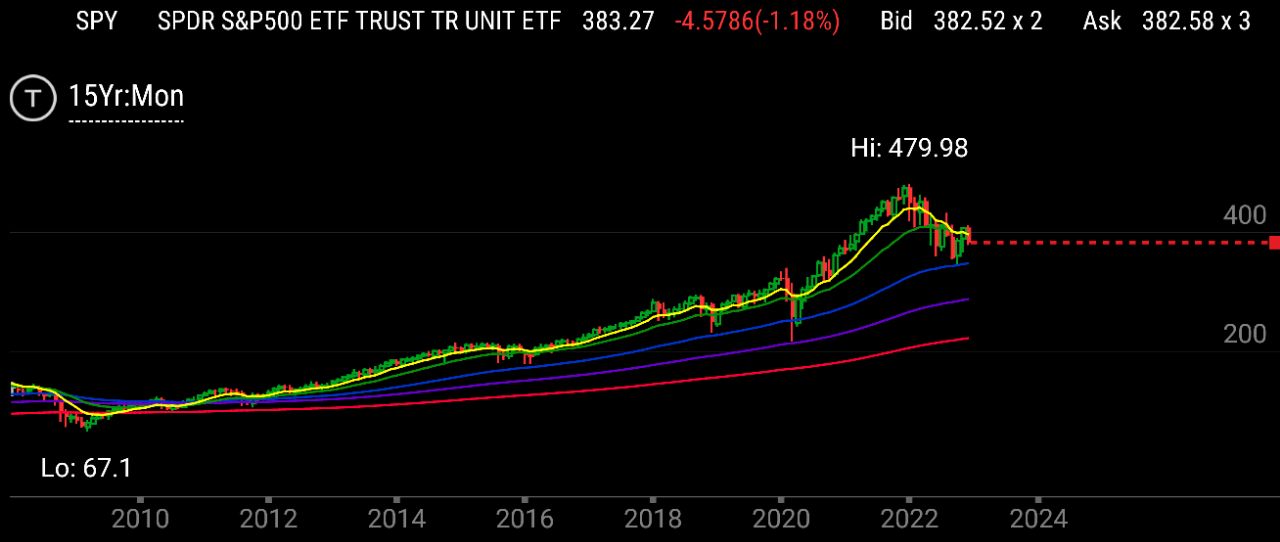
Let’s look at it from the Djed High View…
When price breaks above or below a moving average, it can be difficult to predict how far it will stretch before returning to “home base”.
People, however, are predictable.
A challenge will be viewed in one of two ways: threat or opportunity.
M-onitoring the positional relationship between two (or more) moving averages provides extremely valuable additional data.
I mentioned “technical decision points” earlier in the discussion.
Allow me to U-npack as we arrive at the point of “why so many?”.
Similar to multi-timeframe analysis (MTA), using a specific combination of moving averages allows for a more holistic approach.
Slightly different than MTA, the evaluation is bottom-up beginning with the “longest” moving average.
Our system designates the 253EMA (♥️) as the foundational moving average.